
Visual Functions
Creating Visual Functions
To create a Visual function:
- In the Functions perspective, select Visual Functions and click Add Visual Function on the toolbar.
- In the first step of the wizard, select a data type to visualize with the function.
Figure 1: Selecting a data type to visualize
- In the next step, type in the name and the namespace for the function.
Figure 2: Specifying the name and the namespace
- Click Finish.


The function opens in the function editor.
You can use the function immediately unless you want to adjust its settings and customize the layout.
On the Visual Function Settings tab you can change the default values of the visual function’s settings.
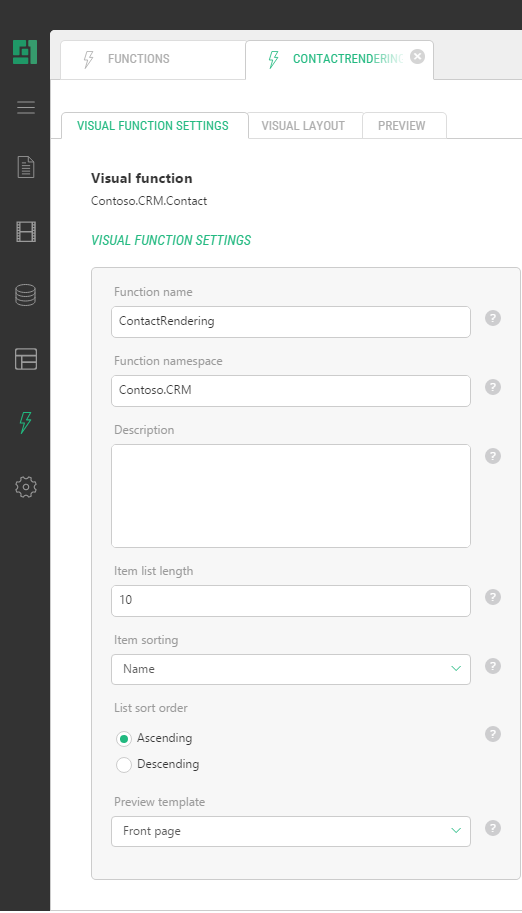
Figure 3: Visual Function Settings
Here are the parameters you can choose to change:
- Function name: The name of the function (which you normally specify when creating the function)
- Function namespace: The namespace the function belongs to (which you normally specify when creating the function)
- Description: The description for the function which the user can read when inserting the function or generating documentation for the function.
- Item list length: The number of data items to display (10 by default). Used as a default value when inserting the function.
- Item sorting: The field by which the items must be sort. You can also use “(random)” for the value. Used as a default value when inserting the function.
- Item sort order: The order of sorting items: ascending or descending (ascending by default). Used as a default value when inserting the function.
- Preview template: The page layout template to use for previewing the function’s output on the Preview tab.
On the Visual Layout tab, you can customize the way the data will be presented.
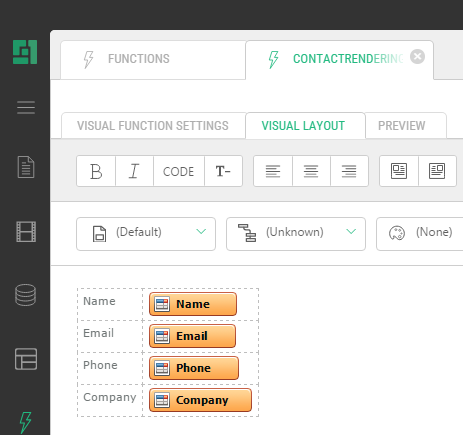
Figure 4: Visual Layout
A special graphic representation is used for a data field. You can remove unnecessary fields by deleting their graphic representations. You can add data fields via the menu: Insert | Field | (specific field).
By default, each data item is presented in a two-column table with field labels in Column 1 and field values in Column 2. Data items are presented in the output as downward repetition of the layout mocked up here.
You can however change the way the data is presented by editing the content on this tab the same way you edit a page in Visual Editor. If you are skilled to edit raw markup, you may as well switch to the Source view and edit the layout markup.
You can preview the function’s output on the Preview tab.
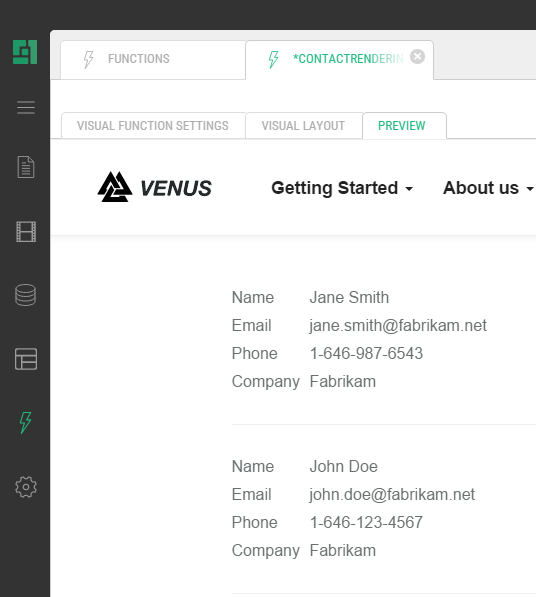
Figure 5: Preview
At least one data item must be added to the data type to appear on the Preview tab.
You can change the page layout template used for previewing in the Preview template parameter on the Visual Function Settings tab.